Результат поиска по запросу: "visual20chart"
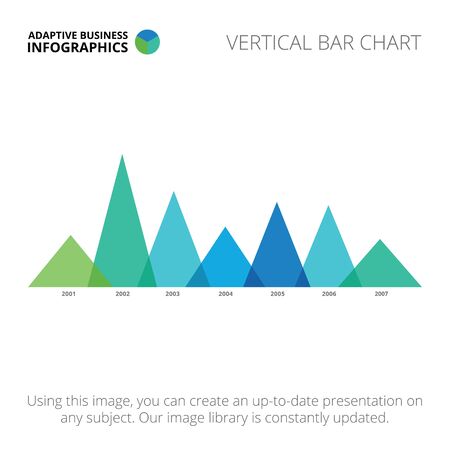
Editable infographic template of vertical bar chart, blue and green version
favorite
Коллекция по умолчанию
Коллекция по умолчанию
Создать новую

Big data visualization. Abstract background with spiral array and binary code. Connection structure. Data array visual concept. Big data connection complex.
favorite
Коллекция по умолчанию
Коллекция по умолчанию
Создать новую
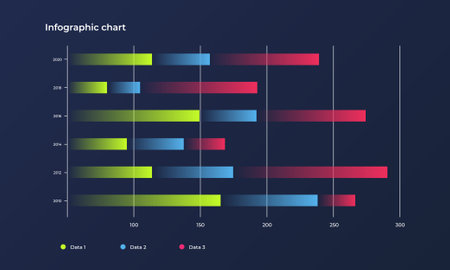
modern infographic vector template with statistics graphs and finance charts. Diagram template and chart graph, graphic information visualization illustration
favorite
Коллекция по умолчанию
Коллекция по умолчанию
Создать новую
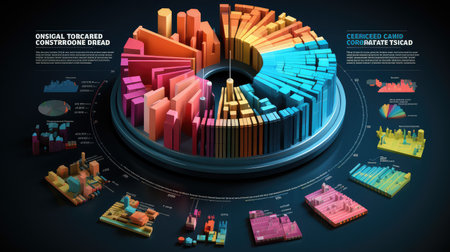
workloads data center infographics
favorite
Коллекция по умолчанию
Коллекция по умолчанию
Создать новую

Charts Graphs paper. Financial development, Banking Account, Statistics, Investment Analytic research data economy, Stock exchange Business office company meeting concept.
favorite
Коллекция по умолчанию
Коллекция по умолчанию
Создать новую
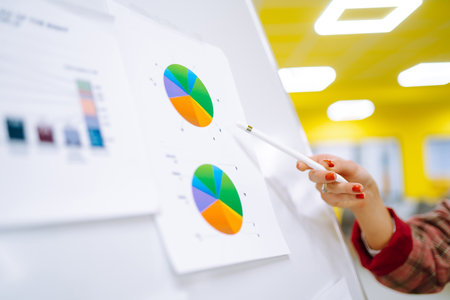
Young woman coach speaker giving flipchart presentation, speaker leading training
favorite
Коллекция по умолчанию
Коллекция по умолчанию
Создать новую

multi color bar charts with two different pencils
favorite
Коллекция по умолчанию
Коллекция по умолчанию
Создать новую
Image of statistics and financial data processing over globe. global business, digital interface, technology and networking concept digitally generated image.
favorite
Коллекция по умолчанию
Коллекция по умолчанию
Создать новую
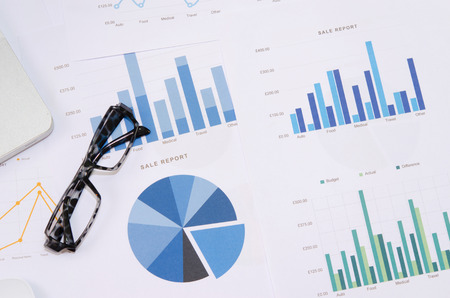
Business paperwork present with diagram.
favorite
Коллекция по умолчанию
Коллекция по умолчанию
Создать новую
graph chart of stock market investment trading.
favorite
Коллекция по умолчанию
Коллекция по умолчанию
Создать новую
financial chart
favorite
Коллекция по умолчанию
Коллекция по умолчанию
Создать новую
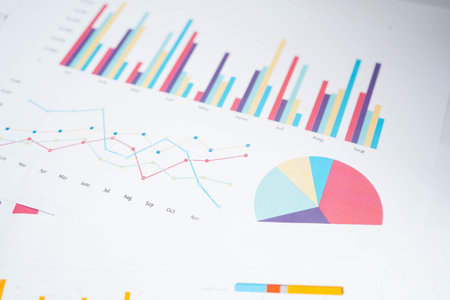
Chart graph paper. Finance, account, statistic, investment data economy, stock exchange business.
favorite
Коллекция по умолчанию
Коллекция по умолчанию
Создать новую

Charts Graphs paper. Financial development, Banking Account, Statistics, Investment Analytic research data economy, Stock exchange Business office company meeting concept.
favorite
Коллекция по умолчанию
Коллекция по умолчанию
Создать новую

Chart graph paper. Finance, account, statistic, investment data economy, stock exchange business.
favorite
Коллекция по умолчанию
Коллекция по умолчанию
Создать новую
favorite
Коллекция по умолчанию
Коллекция по умолчанию
Создать новую

Business people are checking business reports.
favorite
Коллекция по умолчанию
Коллекция по умолчанию
Создать новую
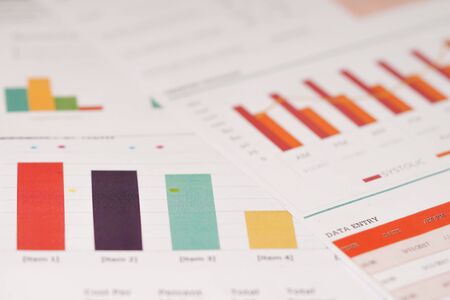
Charts Graphs spreadsheet paper. Financial development, Banking Account, Statistics, Investment Analytic research data economy, Stock exchange Business office company meeting concept.
favorite
Коллекция по умолчанию
Коллекция по умолчанию
Создать новую

The sleek, illuminated bar graph displays data trends on a glossy table in a contemporary office environment at night, highlighting growth and analysis.
favorite
Коллекция по умолчанию
Коллекция по умолчанию
Создать новую
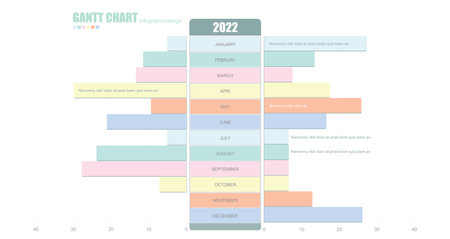
Infographic Monthly modern Timeline Gantt chart table with process. stock illustration Abstract, Bar Graph, Business, Business Finance and Industry
favorite
Коллекция по умолчанию
Коллекция по умолчанию
Создать новую
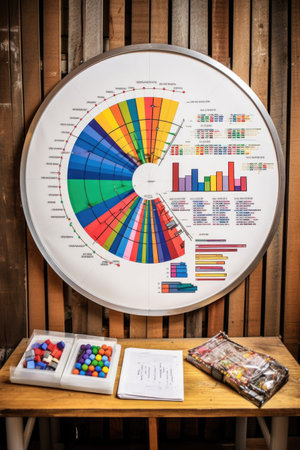
colorful pie charts and bar graphs on a whiteboard, created with generative ai
favorite
Коллекция по умолчанию
Коллекция по умолчанию
Создать новую
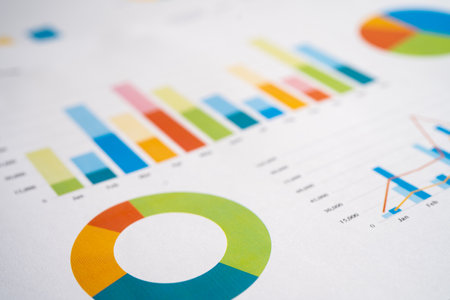
Charts Graphs paper. Financial development, Banking Account, Statistics, Investment Analytic research data economy, Stock exchange Business office company meeting concept.
favorite
Коллекция по умолчанию
Коллекция по умолчанию
Создать новую

Selective focus on detail of euro banknotes. Close up macro detail of money banknotes, 20 euro isolated. World money concept, inflation and economy concept
favorite
Коллекция по умолчанию
Коллекция по умолчанию
Создать новую
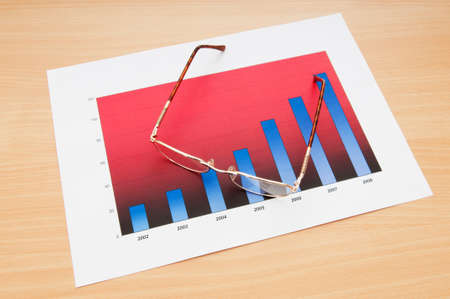
Business concept with charts
favorite
Коллекция по умолчанию
Коллекция по умолчанию
Создать новую

Close up hand of business man with financial report accounting analysis.
favorite
Коллекция по умолчанию
Коллекция по умолчанию
Создать новую

VISUAL CONCEPT
favorite
Коллекция по умолчанию
Коллекция по умолчанию
Создать новую
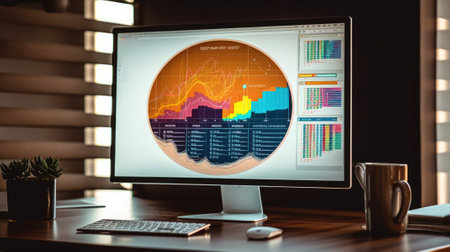
The side view of a computer screen displaying multiple financial reports, graphs and pie in corporate office background. beautiful Generative AI AIG32
favorite
Коллекция по умолчанию
Коллекция по умолчанию
Создать новую
graph chart of stock market investment trading.
favorite
Коллекция по умолчанию
Коллекция по умолчанию
Создать новую
sharp view on business through glasses
favorite
Коллекция по умолчанию
Коллекция по умолчанию
Создать новую
Infographic timeline banner, scheme, chart. Step by step report template. Vector.
favorite
Коллекция по умолчанию
Коллекция по умолчанию
Создать новую

A business professional uses a hand to interact with a colorful pie chart displaying financial metrics in an office setting. The atmosphere is focused and analytical.
favorite
Коллекция по умолчанию
Коллекция по умолчанию
Создать новую

3d illustration of colorful sound wave on dark background. Music concept, A colorful 3D line graph indicating a rise in stock market, AI Generated
favorite
Коллекция по умолчанию
Коллекция по умолчанию
Создать новую

Image of graphs over flag of ukraine. ukraine crisis, economic crisis and international politics concept digitally generated image.
favorite
Коллекция по умолчанию
Коллекция по умолчанию
Создать новую

Business Graph
favorite
Коллекция по умолчанию
Коллекция по умолчанию
Создать новую

Chart, graph and info graphics 3d design for data analysis, seo tools or statistics background
favorite
Коллекция по умолчанию
Коллекция по умолчанию
Создать новую
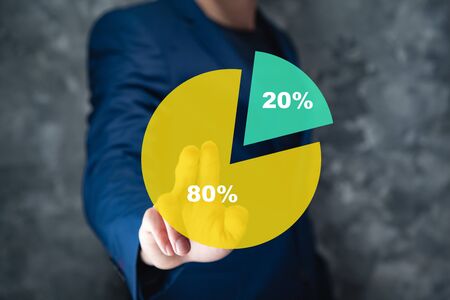
businessman touching pie chart in screen
favorite
Коллекция по умолчанию
Коллекция по умолчанию
Создать новую

Business person evaluates metrics for business growth, setting goals for expansion. Insights on fostering continuous business growth through innovation and strategy. FaaS
favorite
Коллекция по умолчанию
Коллекция по умолчанию
Создать новую

3d render A series of black bars are stacked on top of each other
favorite
Коллекция по умолчанию
Коллекция по умолчанию
Создать новую
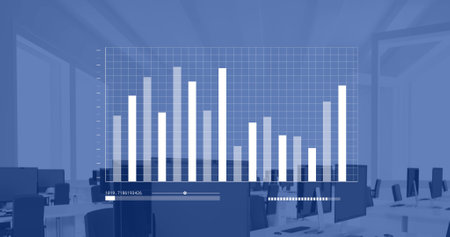
Image of statistical data processing against empty office. Computer interface and business data technology concept
favorite
Коллекция по умолчанию
Коллекция по умолчанию
Создать новую
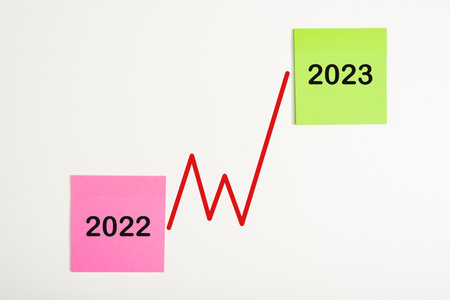
Two stickers memo with text 2022 and 2023, curve red growth chart on white background. Concept of finance, investment.
favorite
Коллекция по умолчанию
Коллекция по умолчанию
Создать новую
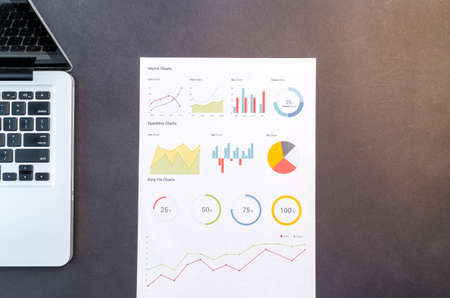
Workplace with notebook on black background
favorite
Коллекция по умолчанию
Коллекция по умолчанию
Создать новую

A detailed view of a paper displaying a bar chart, illustrating data trends and comparisons, A graph that represents the risk and reward ratio of a certain investment, AI Generated
favorite
Коллекция по умолчанию
Коллекция по умолчанию
Создать новую
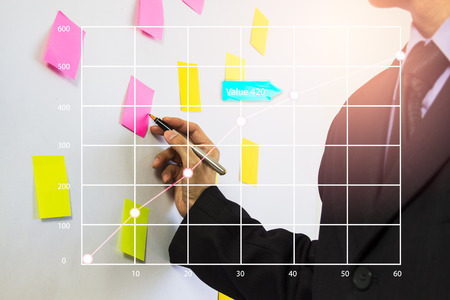
Stock market or forex trading graph and candlestick chart suitable for financial investment concept. Economy trends background for business idea and all art work design. Abstract finance background.
favorite
Коллекция по умолчанию
Коллекция по умолчанию
Создать новую
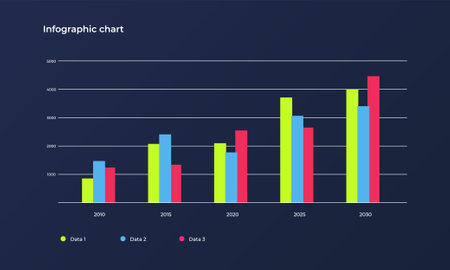
modern infographic vector template with statistics graphs and finance charts. Diagram template and chart graph, graphic information visualization illustration
favorite
Коллекция по умолчанию
Коллекция по умолчанию
Создать новую

Financial graph colorful drawing and table with computer on background. Double exposure. Concept of international markets.
favorite
Коллекция по умолчанию
Коллекция по умолчанию
Создать новую

Businessman analysis profitability of working companies with digital augmented reality graphics, positive indicators in 2023, businessman calculates financial data for long term investments.
favorite
Коллекция по умолчанию
Коллекция по умолчанию
Создать новую

Business analyze,Close up Business people meeting to discuss the situation on the market. Business Financial Concept
favorite
Коллекция по умолчанию
Коллекция по умолчанию
Создать новую
Pen, Glasses and Patient Form on desktop in business office.
favorite
Коллекция по умолчанию
Коллекция по умолчанию
Создать новую

2024 business target goal finance technology and investment stock market trading concept. businessman holding tablet virtual graph icon analysing forex or crypto currency trading graph financial data.
favorite
Коллекция по умолчанию
Коллекция по умолчанию
Создать новую
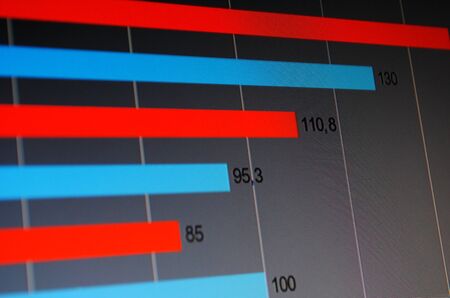
Stock market graphs on the computer monitor.
favorite
Коллекция по умолчанию
Коллекция по умолчанию
Создать новую
Color palette, Sample color catalog, Rainbow background
favorite
Коллекция по умолчанию
Коллекция по умолчанию
Создать новую

Stock market graph and table with computer background. Double exposure. Concept of financial analysis.
favorite
Коллекция по умолчанию
Коллекция по умолчанию
Создать новую

Project manager working on tablet. updating tasks and milestones progress planning with Gantt chart scheduling interface for company on virtual screen. Business 2nd quarter Project Management System
favorite
Коллекция по умолчанию
Коллекция по умолчанию
Создать новую
Analysis Analytic Marketing Sharing Graph Diagram Concept
favorite
Коллекция по умолчанию
Коллекция по умолчанию
Создать новую
top view of multicolor statistic graphs and pie charts on white background
favorite
Коллекция по умолчанию
Коллекция по умолчанию
Создать новую
Finance Growth Business Marketing Success Analysis Concept
favorite
Коллекция по умолчанию
Коллекция по умолчанию
Создать новую
Dynamic LED Screen Mockup for Vibrant Displays - AI Generated
favorite
Коллекция по умолчанию
Коллекция по умолчанию
Создать новую

Businessman showing business growth and success graph ,concept of progress in development, financial efficiency and investment with business strategy for goals and opportunities in the industry future
favorite
Коллекция по умолчанию
Коллекция по умолчанию
Создать новую

Poster infographics information business modern design set proposal advert. Vector illustration with graphic scheme
favorite
Коллекция по умолчанию
Коллекция по умолчанию
Создать новую
Business graph and chart on table. Business and finance concept. 3D Rendering
favorite
Коллекция по умолчанию
Коллекция по умолчанию
Создать новую

Graphic designer brainstorm and graphic art at busy creative studio workshop. Experiment and brainstorm color palette and pattern at workspace table for creative design. Panorama shot. Scrutinize
favorite
Коллекция по умолчанию
Коллекция по умолчанию
Создать новую
Business image
favorite
Коллекция по умолчанию
Коллекция по умолчанию
Создать новую

word on an abstract colored background
favorite
Коллекция по умолчанию
Коллекция по умолчанию
Создать новую

Analysis, chart and screen hologram of stock market, financial management and investment profit
favorite
Коллекция по умолчанию
Коллекция по умолчанию
Создать новую
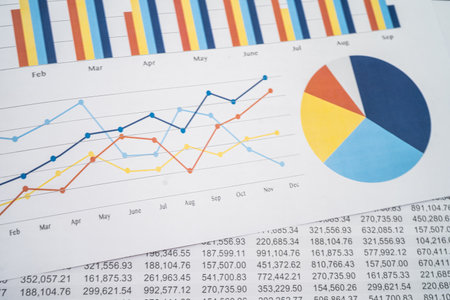
chart or graph paper. Financial, account, statistics and business data concept.
favorite
Коллекция по умолчанию
Коллекция по умолчанию
Создать новую

Businessman pointing at virtual graph target goals year 2023 to 2024. Resolution statistics graph year 2024. Chart plan management economic finance marketing goal future.
favorite
Коллекция по умолчанию
Коллекция по умолчанию
Создать новую

Medical marketing and Health care business analysis report. Medical marketing concept
favorite
Коллекция по умолчанию
Коллекция по умолчанию
Создать новую

Double exposure of mans hands holding and using a phone and financial graph drawing. Analysis concept.
favorite
Коллекция по умолчанию
Коллекция по умолчанию
Создать новую

Business person evaluates metrics for business growth, setting goals for expansion. Insights on fostering continuous business growth through innovation and strategy. FaaS
favorite
Коллекция по умолчанию
Коллекция по умолчанию
Создать новую

Double exposure of forex graph hologram over desktop with phone. Top view. Mobile trade platform concept.
favorite
Коллекция по умолчанию
Коллекция по умолчанию
Создать новую

Business success, growing, growth chart increase up concept. White cube block on yellow background. growth of economic indicators. Cubes with growth chart are arranging in circle on yellow background.
favorite
Коллекция по умолчанию
Коллекция по умолчанию
Создать новую

UX UI and Programming development technology.
favorite
Коллекция по умолчанию
Коллекция по умолчанию
Создать новую
Donut Chart. Elements of infographics on a dark background. Use in presentation templates, mobile app and corporate report. Dashboard UI and UX Kit.
favorite
Коллекция по умолчанию
Коллекция по умолчанию
Создать новую

Finance concept - Financial accounting stock market graphs analysis. Calculator, notebook with blank sheet of paper, pen on chart. Top view.
favorite
Коллекция по умолчанию
Коллекция по умолчанию
Создать новую
Image two business partners talking and working together.Business concept
favorite
Коллекция по умолчанию
Коллекция по умолчанию
Создать новую
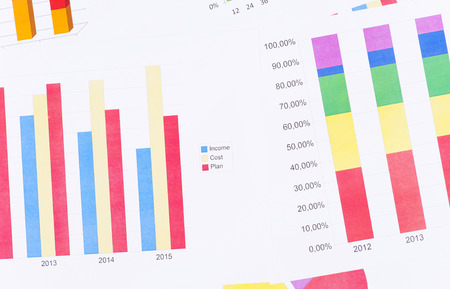
Business charts with details and numbers
favorite
Коллекция по умолчанию
Коллекция по умолчанию
Создать новую
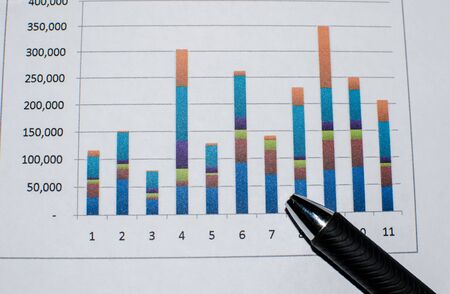
Financial graphs analysis and pen.
favorite
Коллекция по умолчанию
Коллекция по умолчанию
Создать новую
many colorful pie and bar charts background
favorite
Коллекция по умолчанию
Коллекция по умолчанию
Создать новую

Multi exposure of forex graph hologram over desktop with phone. Top view. Mobile trade platform concept.
favorite
Коллекция по умолчанию
Коллекция по умолчанию
Создать новую

Close up of asian businessman surfing the internet, searching information on laptop computer and digital tablet pc, online working from home office, telecommuting. Freelancer working on computer
favorite
Коллекция по умолчанию
Коллекция по умолчанию
Создать новую

Graphic designer brainstorm logo and graphic art at busy creative studio workshop. Experiment and brainstorm color palette and pattern at workspace table for creative design. Panorama shot. Scrutinize
favorite
Коллекция по умолчанию
Коллекция по умолчанию
Создать новую
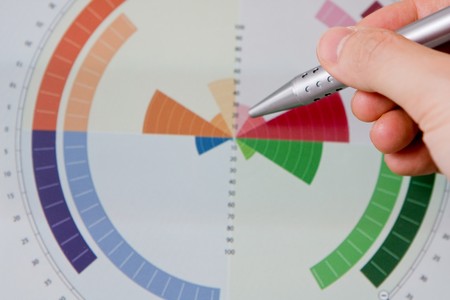
Hand holding pen pointing towards a chart or graph
favorite
Коллекция по умолчанию
Коллекция по умолчанию
Создать новую
An algorithm predicting market trends based on history
favorite
Коллекция по умолчанию
Коллекция по умолчанию
Создать новую

a box with neon lights displaying a number, featuring a realistic and detailed rendering reminiscent of 20th-century art. the image showcases lens flares, indicating a vibrant and dynamic composition. this captivating artwork, a contest winner, highlights the use of glass as a material, with a striking combination of light red and azure colors. the realistic usage of light and color adds depth and visual appeal
favorite
Коллекция по умолчанию
Коллекция по умолчанию
Создать новую

Hands writing information about stock market in notepad. Forex chart holograms in front. Concept of research. Multi exposure
favorite
Коллекция по умолчанию
Коллекция по умолчанию
Создать новую
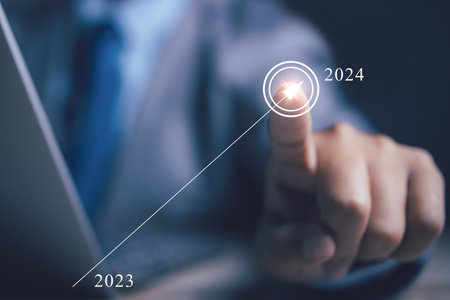
Businessman pointing target in 2024. Progress business growing potential success
favorite
Коллекция по умолчанию
Коллекция по умолчанию
Создать новую
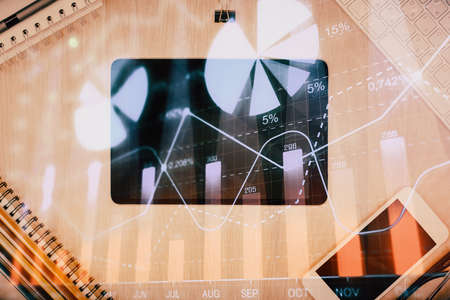
Double exposure of forex graph hologram over desktop with phone. Top view. Mobile trade platform concept.
favorite
Коллекция по умолчанию
Коллекция по умолчанию
Создать новую

Business document Financial chart and graph.
favorite
Коллекция по умолчанию
Коллекция по умолчанию
Создать новую

Growth in 2020 year. Business graph with arrow up. Mixed Media Corporate Background.
favorite
Коллекция по умолчанию
Коллекция по умолчанию
Создать новую

This photo showcases a close up of a wooden table with a clearly visible graph, providing a detailed representation of data, A line graph showcasing cryptocurrency investment trends, AI Generated
favorite
Коллекция по умолчанию
Коллекция по умолчанию
Создать новую
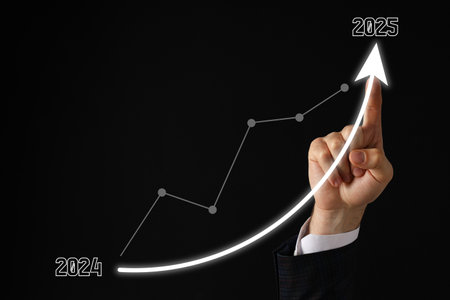
Goals 2025, the concept of planning and calculating the strategy for the next year.
favorite
Коллекция по умолчанию
Коллекция по умолчанию
Создать новую

Business analyze,Close up Business people meeting to discuss the situation on the market. Business Financial Concept
favorite
Коллекция по умолчанию
Коллекция по умолчанию
Создать новую
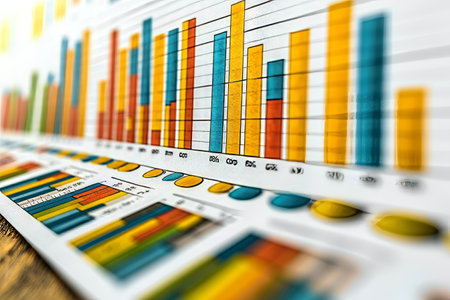
Detailed bar charts and graphs illustrate data trends and statistics across various categories, highlighting important information for analysis in a research or business context.
favorite
Коллекция по умолчанию
Коллекция по умолчанию
Создать новую

Team of professional business partners holding pen pointing at financial graph document, calculating analysis and strategy consulting. Meeting, brainstorming at office, teamwork co
favorite
Коллекция по умолчанию
Коллекция по умолчанию
Создать новую
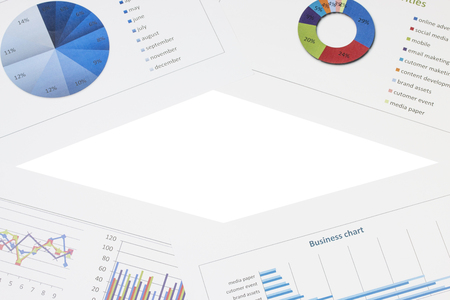
Graph chart and financial chart as a background - Business concept with free text space
favorite
Коллекция по умолчанию
Коллекция по умолчанию
Создать новую

chart or graph paper. Financial, account, statistics and business data concept.
favorite
Коллекция по умолчанию
Коллекция по умолчанию
Создать новую

Financial statistics documents ball pen infographics
favorite
Коллекция по умолчанию
Коллекция по умолчанию
Создать новую

Vibrant minimalist bar graph illustration with yellow and blue bars against black background
favorite
Коллекция по умолчанию
Коллекция по умолчанию
Создать новую

A group of business people meet outdoors. Male employees in suits communicate outdoors. Business partners discuss and argue. Relationships and promotion. Teamwork and friendship
favorite
Коллекция по умолчанию
Коллекция по умолчанию
Создать новую

Stock market or forex trading graph in graphic concept suitable for financial investment or Economic trends business idea and all art work design.
favorite
Коллекция по умолчанию
Коллекция по умолчанию
Создать новую
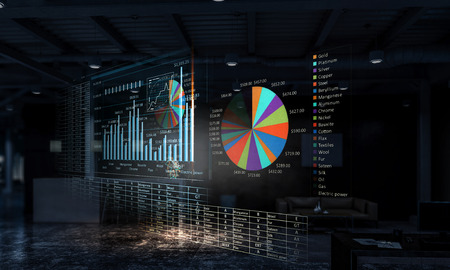
Media panel with infographs in dark office. Mixed media
favorite
Коллекция по умолчанию
Коллекция по умолчанию
Создать новую
Поддержка
Copyright © Legion-Media.


